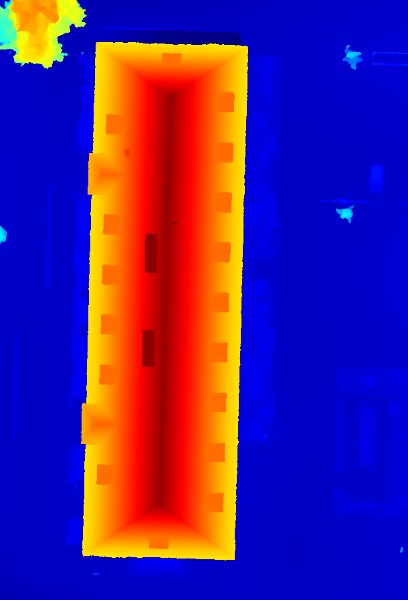
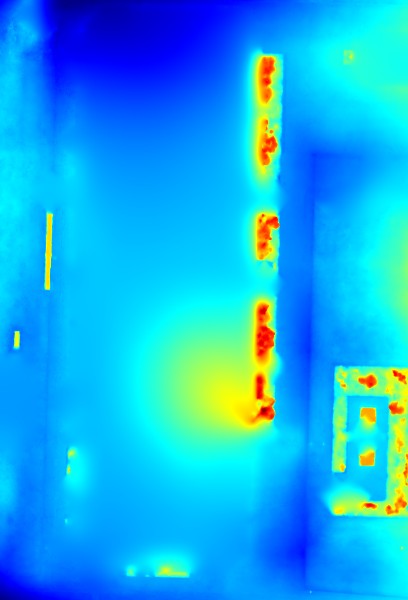
RealityScan Selected Ortho Projection Report

Bericht über ausgewählte Orthoprojektion

Projekt: SEH

Mon, Jan 26, 2026 09:53:14

RealityScan 2.0.1.118647 RS

Orthoprojektionsname Ortho projection 6
Komponentenname Component 1
Georeferenziert True
Verfügt über ein digitales Geländemodell True
Rendering method True ortho from a colored model
Breite [Pixel] 610
Höhe [Pixel] 897
Einheiten pro Spaltenpixel 0.080271
Einheiten pro Zeilenpixel 0.080337
Tiefe der Begrenzungsbox (Länge in der x-Richtung) 48.965038 m
Breite der Begrenzungsbox (Länge in der y-Richtung) 72.062584 m
Höhe der Begrenzungsbox (Länge in der z-Richtung) 35.013195 m
Schnittvolumen 36418.11 m3
Füllvolumen 87127.60 m3
Fläche 2D 3518.84 m2
Fläche 3D 6719.46 m2
Koordinatensystem epsg:4326 - GPS (WGS 84)
Orthoprojektionstyp Map (GPS)
Projektion Lat/long (Geodetic alias)
Zentrum der Begrenzungsbox in epsg:4326 - GPS (WGS 84) Koordinatensystem lat: 52° 6' 53.9793'' N
lon: 8° 41' 32.8344'' E
alt: 164.040176 m
Ecken in epsg:4326 - GPS (WGS 84) Koordinatensystem NW: lat: 52° 6' 55.1451'' N , lon: 8° 41' 31.5478'' E
NE: lat: 52° 6' 55.145'' N , lon: 8° 41' 34.121'' E
SE: lat: 52° 6' 52.8136'' N , lon: 8° 41' 34.121'' E
SW: lat: 52° 6' 52.8136'' N , lon: 8° 41' 31.5478'' E
Nullmeridian greenwich
Einheiten Meter
Bild- und DOM-Rasterisierungszeit 00h:00m:01s
DGM Generierungszeit 00h:00m:04s
Gesamtdauer 00h:00m:10s
True Ortho-projection Digital Surface Model Digital Terrain Model
150.42 m
170.78 m
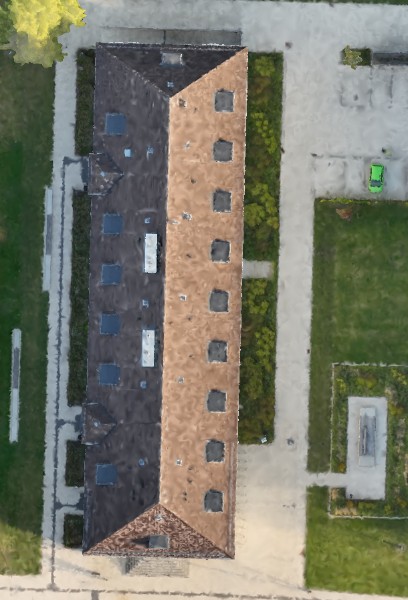
Abbildung 1: Vorschau der Bildebene der Orthoprojektion (links), DOM- und DGM-Höhenebene mit Maßstab (rechts)

Abbildung 2: Verteilung der Kontrollpunkte auf der Bildebene des Orthoprojektions

Line 37 Line 38 Line 39 Line 40 Region 1 Region 2 Region 3 Region 4

Figure 3: regions

Region Schnittvolumen [m³] Füllvolumen [m³] Fläche 2d [m²] Fläche 3d [m²]
Position along the boundary [m] Höhenlage [m]

Abbildung 4: Height profile along the boundary of Line 37 ().

Position along the boundary [m] Höhenlage [m]

Abbildung 5: Height profile along the boundary of Line 38 ().

Position along the boundary [m] Höhenlage [m]

Abbildung 6: Height profile along the boundary of Line 39 ().

Position along the boundary [m] Höhenlage [m]

Abbildung 7: Height profile along the boundary of Line 40 ().

Position along the boundary [m] Höhenlage [m]

Abbildung 8: Height profile along the boundary of Region 1 ().

Position along the boundary [m] Höhenlage [m]

Abbildung 9: Height profile along the boundary of Region 2 ().

Position along the boundary [m] Höhenlage [m]

Abbildung 10: Height profile along the boundary of Region 3 ().

Position along the boundary [m] Höhenlage [m]

Abbildung 11: Height profile along the boundary of Region 4 ().

Region Punkt-ID Längengrad Breitengrad Höhenlage [m] Entfernung vom Startpunkt [m]